 ChatGPT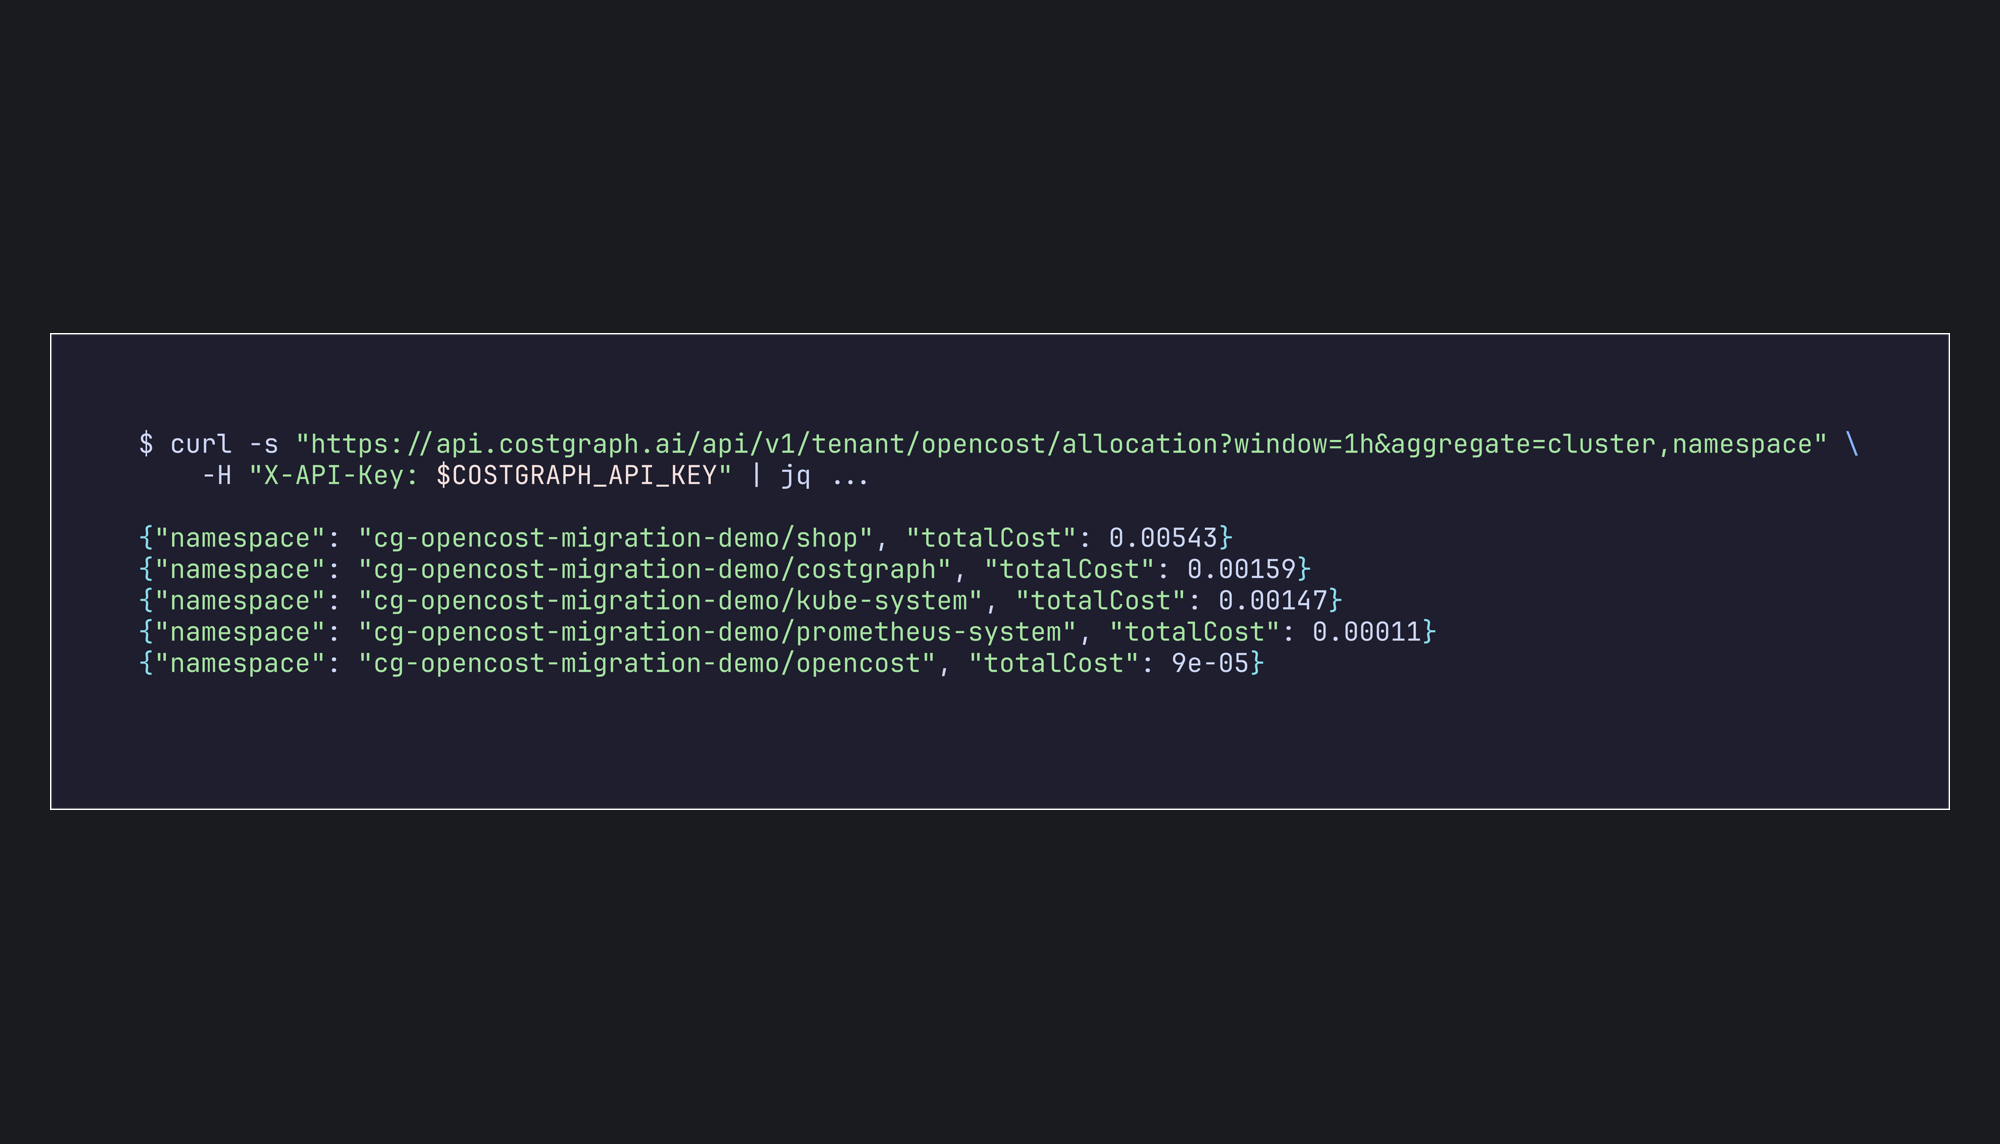
OpenCost answers one question well: what does each namespace, workload, and pod in this cluster cost. It stops at the cluster edge. The database the cluster talks to, the AI API the pods call, and the CI minutes that built the image sit on other bills, and the question of who owns that spend is left to a spreadsheet.
CostGraph now serves the OpenCost API. The tools you built on OpenCost keep working after you switch, and the same account covers the bills outside the cluster, tells you which workloads to resize, and lets you assign spend to teams and customers without relabelling anything. This post moves a cluster from OpenCost to CostGraph and then shows the common OpenCost tasks done with the CostGraph CLI.
We run it on a two-node EKS cluster so every command and every number below is real. You can follow along on your own cluster; the steps are the same.
Why move
- Same API. Existing scrapers, budget checks, and scripts point at a new base URL with a key. The routes, parameters, and response fields are the ones OpenCost defines.
- Bills outside the cluster. CostGraph connects to the clouds, AI APIs, databases, and tools you pay for, so the cluster's cost sits next to what runs around it.
- Something to do about it. Rightsizing recommendations name the request or instance type to move to and the saving.
- Ownership without labels. Virtual tags assign spend to teams and customers from rules, and nothing is written back to the cluster.
- No Prometheus to run. The operator ships its own scrapers.
Prerequisites
- A CostGraph account and an API key with the
operator:readscope from Settings > API keys. - The CostGraph CLI installed and signed in:
curl -fsSL costgraph.ai/cli | shthencostgraph auth login. - A Kubernetes cluster running OpenCost. We create one below with eksctl; skip that section if you already have one.
helm,kubectl,curl, andjq.
Create the cluster and install OpenCost
We'll begin by creating a two-node cluster with eksctl from a config file. Keeping the file means the tear-down at the end is one command against the same file:
cat > cg-opencost.yaml <<'CONFIG'
apiVersion: eksctl.io/v1alpha5
kind: ClusterConfig
metadata:
  name: cg-opencost-migration-demo
  region: us-east-1
  version: "1.31"
managedNodeGroups:
  - name: workers
    instanceType: t3.medium
    desiredCapacity: 2
    minSize: 2
    maxSize: 2
    volumeSize: 20
CONFIG
eksctl create cluster -f cg-opencost.yaml
kubectl get nodes
OpenCost reads from Prometheus, so install Prometheus first with the scrape config OpenCost's chart expects, then OpenCost itself. A fresh EKS cluster has no storage driver, so Prometheus runs without a persistent volume here; on a cluster that has one, drop that flag:
helm install prometheus prometheus-community/prometheus \
  --namespace prometheus-system --create-namespace \
  --set prometheus-pushgateway.enabled=false \
  --set alertmanager.enabled=false \
  --set server.persistentVolume.enabled=false \
  -f https://raw.githubusercontent.com/opencost/opencost/develop/kubernetes/prometheus/extraScrapeConfigs.yaml

helm install opencost opencost/opencost --namespace opencost --create-namespace
kubectl get pods -n opencost
Give it something to measure. This creates a shop namespace with two deployments that declare CPU and memory requests:
kubectl create namespace shop
kubectl -n shop apply -f - <<'MANIFEST'
apiVersion: apps/v1
kind: Deployment
metadata:
  name: storefront
spec:
  replicas: 3
  selector:
    matchLabels: { app: storefront }
  template:
    metadata:
      labels: { app: storefront }
    spec:
      containers:
        - name: web
          image: nginx:1.27-alpine
          resources:
            requests: { cpu: 250m, memory: 256Mi }
            limits: { cpu: 500m, memory: 512Mi }
---
apiVersion: apps/v1
kind: Deployment
metadata:
  name: checkout
spec:
  replicas: 2
  selector:
    matchLabels: { app: checkout }
  template:
    metadata:
      labels: { app: checkout }
    spec:
      containers:
        - name: api
          image: nginx:1.27-alpine
          resources:
            requests: { cpu: 500m, memory: 512Mi }
            limits: { cpu: 1, memory: 1Gi }
MANIFEST
This is the OpenCost query most people run, cost by namespace over the last hour, through a port-forward to the OpenCost service:
kubectl -n opencost port-forward svc/opencost 9003:9003 &
curl -s "http://localhost:9003/allocation/compute?window=1h&aggregate=namespace" \
  | jq '.data[0] | to_entries[] | {namespace: .key, totalCost: .value.totalCost}'
{
  "namespace": "costgraph",
  "totalCost": 0.00576
}
{
  "namespace": "kube-system",
  "totalCost": 0.0053
}
{
  "namespace": "opencost",
  "totalCost": 0.00034
}
{
  "namespace": "prometheus-system",
  "totalCost": 0.00043
}
{
  "namespace": "shop",
  "totalCost": 0.01962
}
Install the CostGraph operator
The operator runs beside OpenCost. Nothing stops until we remove OpenCost at the end, so the two can be compared on the same cluster.
helm repo add costgraph http://charts.costgraph.ai/
helm repo update
helm install costgraph-operator costgraph/costgraph-operator \
  --namespace costgraph --create-namespace \
  --set global.clusterName=cg-opencost-migration-demo \
  --set global.apiKey=$COSTGRAPH_API_KEY \
  --set flowtrace.enabled=false
kubectl get pods -n costgraph
flowtrace is the operator's network tracer. It needs a BPF-enabled kernel and a host-mounted cgroup v2 filesystem, which the default EKS node image doesn't give it, so we leave it off. Cost allocation doesn't depend on it.
NAME                                                     READY   STATUS    RESTARTS      AGE
costgraph-operator-cadvisor-2h4rg                        1/1     Running   0             41h
costgraph-operator-cadvisor-n7cdl                        1/1     Running   0             41h
costgraph-operator-kube-state-metrics-55b8676946-dchqn   1/1     Running   0             41h
costgraph-operator-kubernetes-68554975d6-9lb4h           1/1     Running   0             41h
costgraph-operator-prometheus-7679c5448b-jwnxf           1/1     Running   2 (40h ago)   41h
costgraph-operator-prometheus-node-exporter-dbmcs        1/1     Running   0             41h
costgraph-operator-prometheus-node-exporter-z2x9r        1/1     Running   0             41h
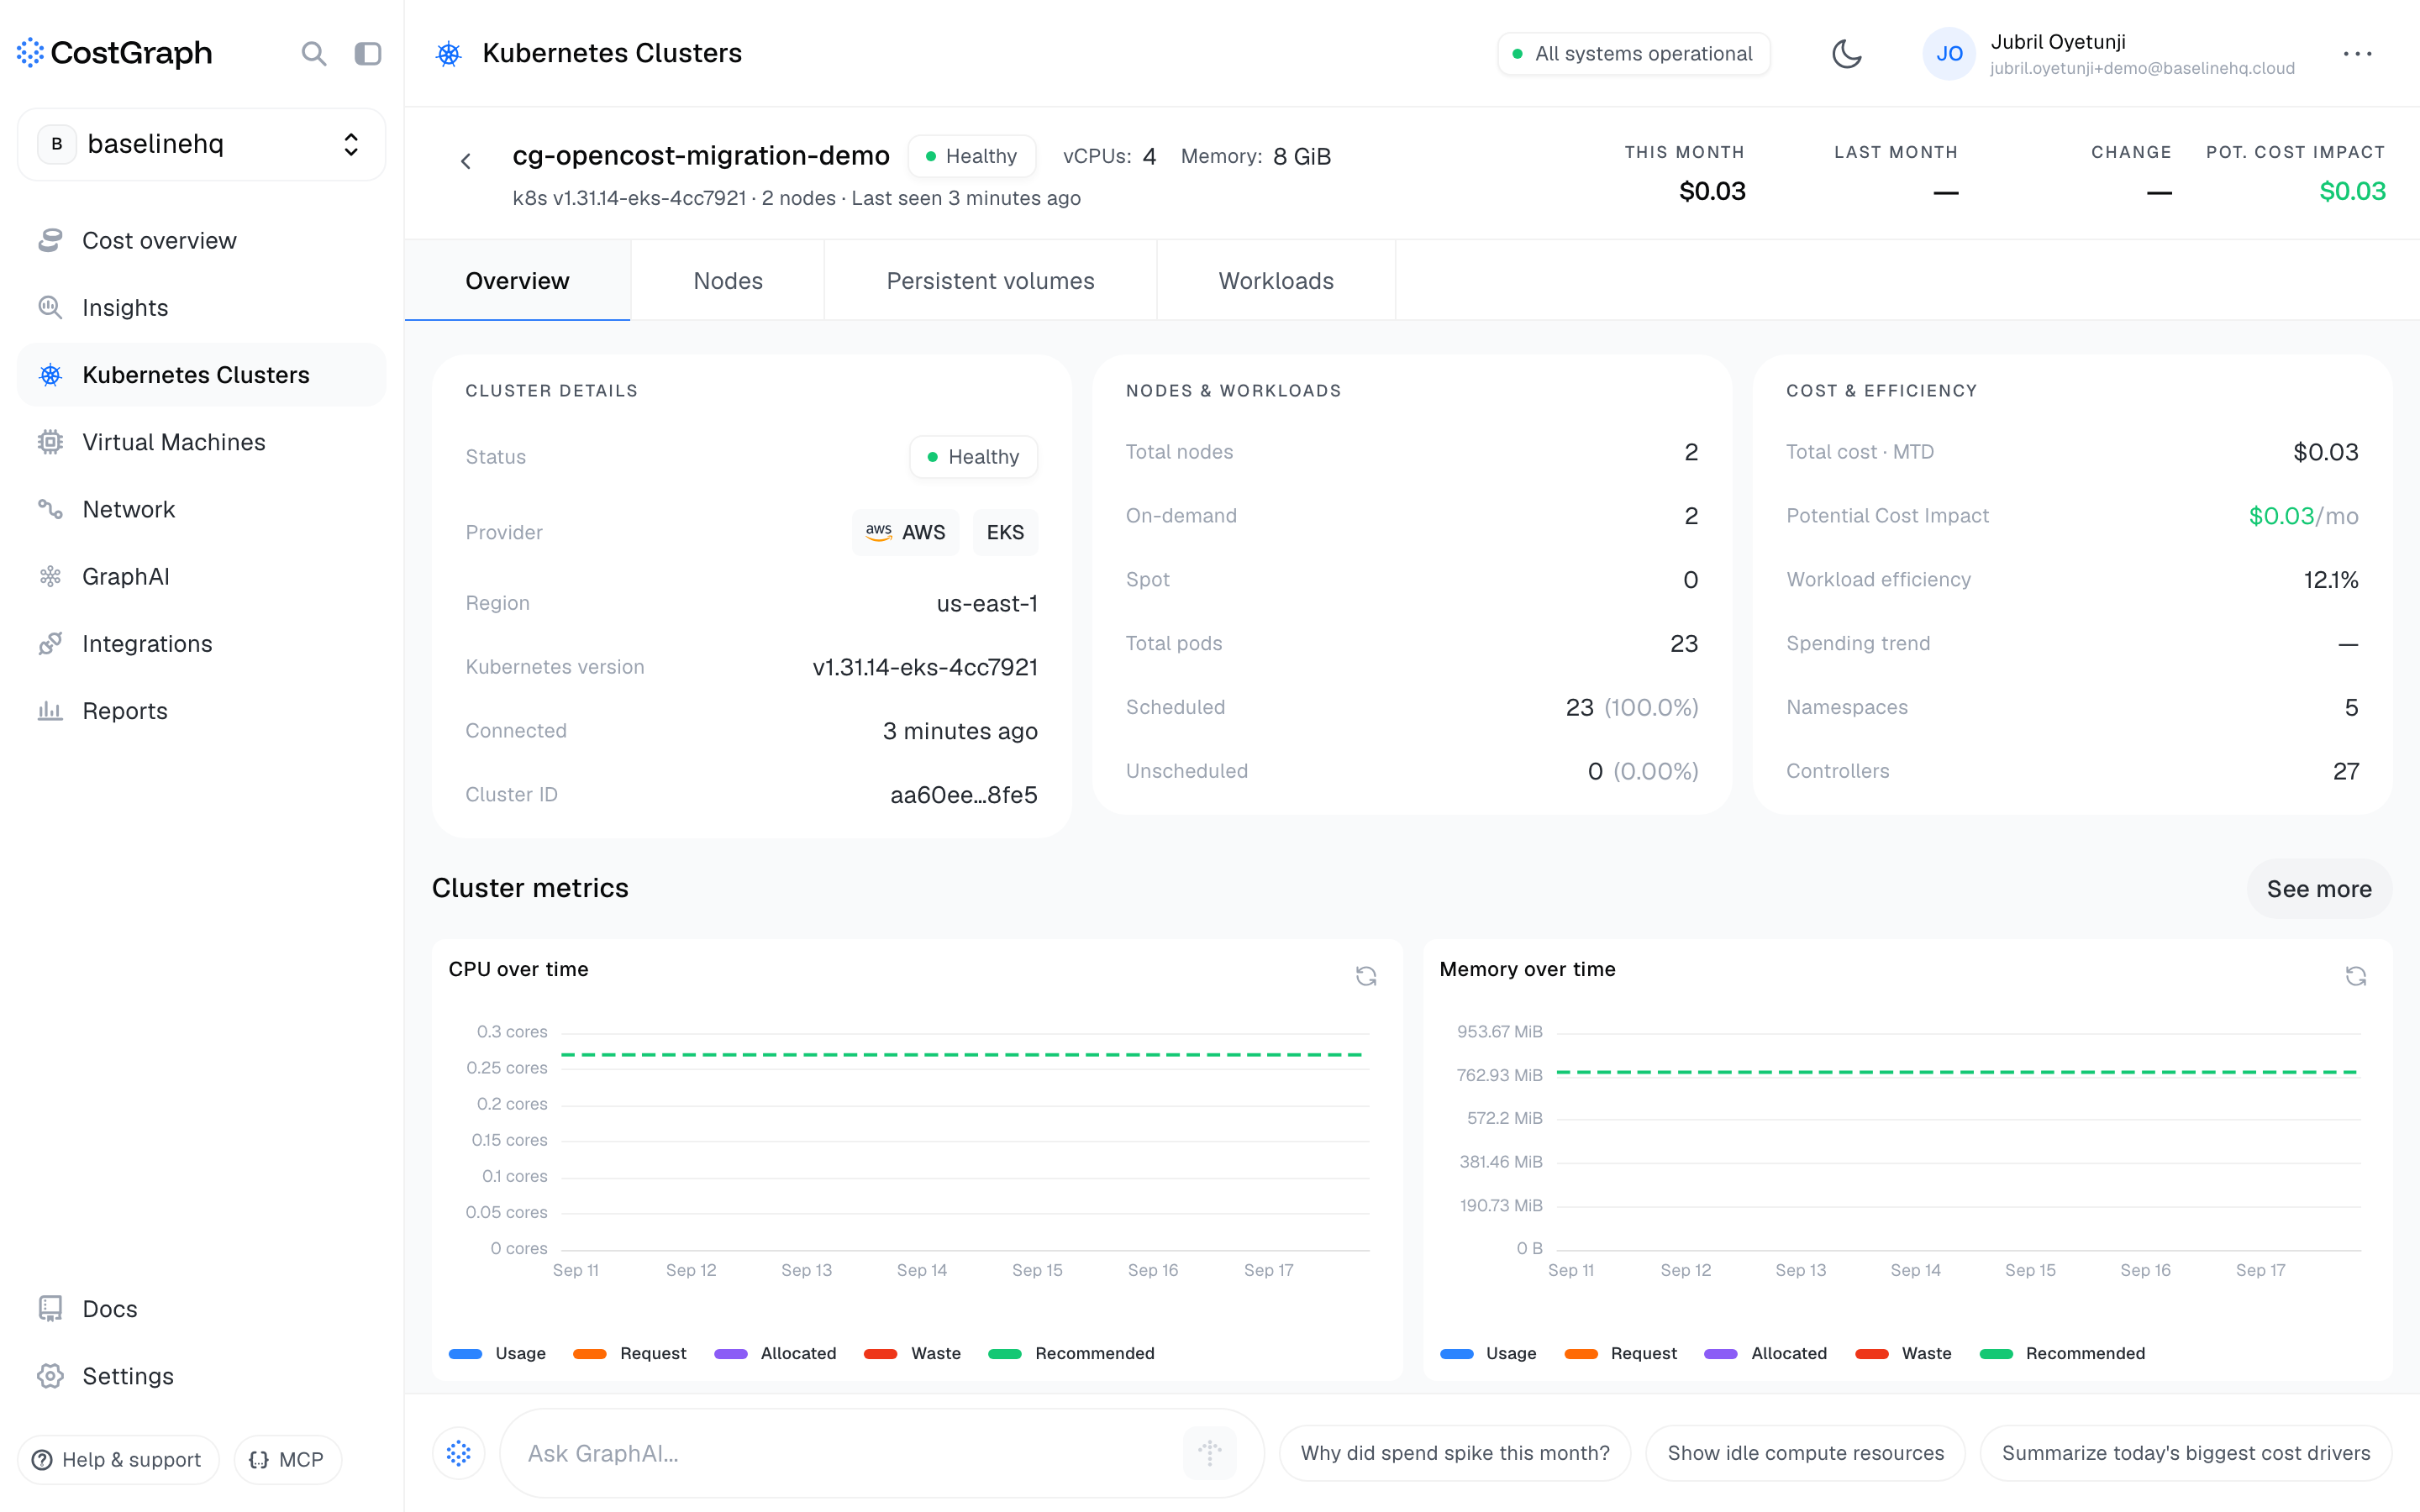
After the pods are running, the cluster appears under Kubernetes Clusters in CostGraph within a few minutes.
Point your clients at CostGraph
Every client that read OpenCost needs two changes: the base URL and a header that carries the key.
https://api.costgraph.ai/api/v1/tenant/opencost
X-API-Key: bl_your_key
The query from before, against CostGraph. The only differences are the host and the header:
curl -s "https://api.costgraph.ai/api/v1/tenant/opencost/allocation?window=1h&aggregate=cluster,namespace" \
  -H "X-API-Key: $COSTGRAPH_API_KEY" \
  | jq '.data[0] | to_entries[] | select(.key | startswith("cg-opencost-migration-demo/")) | {namespace: .key, totalCost: .value.totalCost}'
{"namespace": "cg-opencost-migration-demo/shop", "totalCost": 0.00543}
{"namespace": "cg-opencost-migration-demo/costgraph", "totalCost": 0.00159}
{"namespace": "cg-opencost-migration-demo/kube-system", "totalCost": 0.00147}
{"namespace": "cg-opencost-migration-demo/prometheus-system", "totalCost": 0.00011}
{"namespace": "cg-opencost-migration-demo/opencost", "totalCost": 9e-05}
We aggregate by cluster and namespace here because a CostGraph tenant holds every cluster you connect, where an OpenCost install holds one.
A CI budget check keeps its shape. This fails the job when a namespace spends more than its budget over seven days:
#!/usr/bin/env sh
set -eu
NAMESPACE="$1"
BUDGET_USD="$2"

spent=$(curl -sf "https://api.costgraph.ai/api/v1/tenant/opencost/allocation?window=7d&aggregate=cluster,namespace" \
  -H "X-API-Key: $COSTGRAPH_API_KEY" \
  | jq -r --arg ns "cg-opencost-migration-demo/$NAMESPACE" '.data[0][$ns].totalCost // 0')

echo "$NAMESPACE spent $spent USD in the last 7 days (budget $BUDGET_USD)"
awk -v s="$spent" -v b="$BUDGET_USD" 'BEGIN { exit (s > b) }'
The same questions, from the CLI
Most of what people ask OpenCost is a handful of questions. Here they are with the CostGraph CLI, which reads the same tenant the dashboard and the API do.
Cost by provider across everything the tenant pays for. The cluster's nodes land under AWS once the day's bill arrives; the rest is what OpenCost never saw:
costgraph cost get --group-by provider
Total 90,456.74 (previous 285,602.25, -68.3%)
  Net:                89,680.29 (credits -776.45)
  Daily average:      5,373.67
  Group by:           provider
Previous period has no comparable data; change values are not meaningful.

 NAME                  CURRENT    PREVIOUS   CHANGE  SHARE
 ──────────────────────────────────────────────────────────
 ▎ datadog           87,528.64  168,152.09   -47.9%  96.8%
 ──────────────────────────────────────────────────────────
 ▎ envoy_ai_gateway     590.64        0.00      new   0.7%
 ──────────────────────────────────────────────────────────
 ▎ agentgateway         590.18        0.00      new   0.7%
 ──────────────────────────────────────────────────────────
 ▎ vllm                 566.97        0.00      new   0.6%
 ──────────────────────────────────────────────────────────
 ▎ apisix               295.89        0.00      new   0.3%
 ──────────────────────────────────────────────────────────
 ▎ openrouter            48.58        0.00      new   0.1%
 ──────────────────────────────────────────────────────────
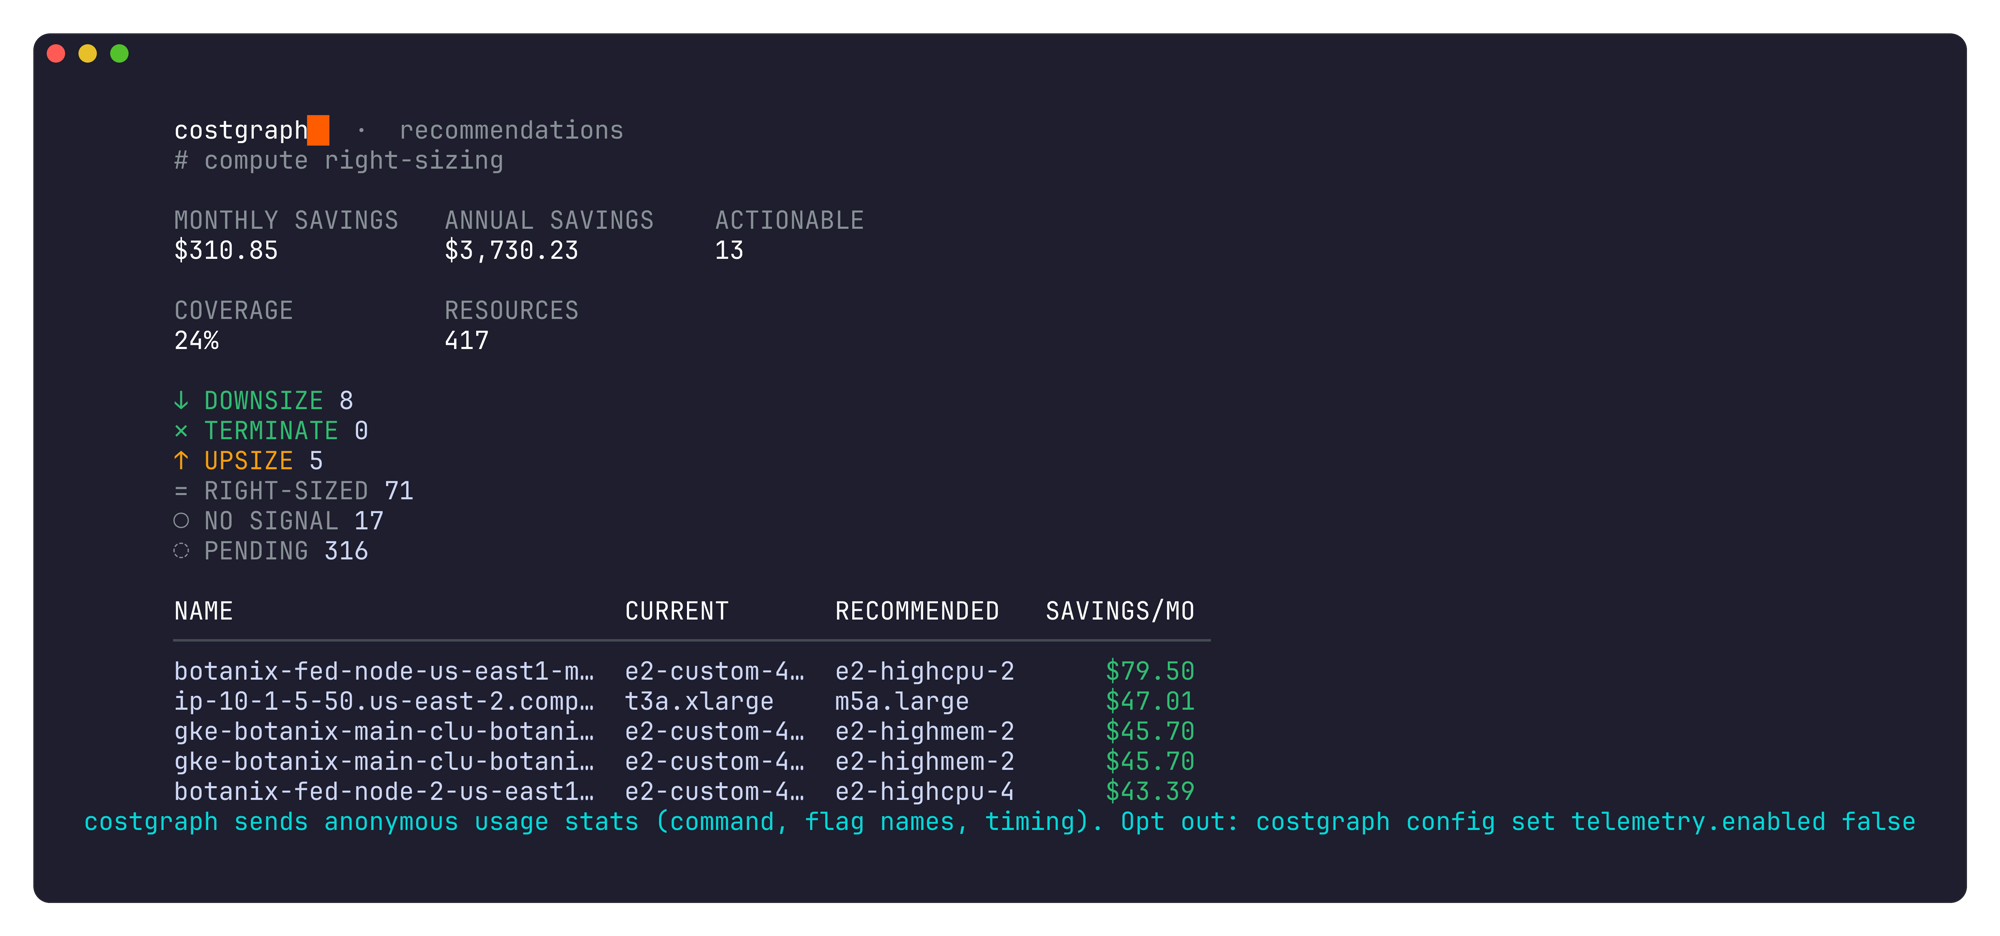
Which workloads are oversized, and what to change:
costgraph recommendations summary
 costgraph   ·  recommendations
 # compute right-sizing

 MONTHLY SAVINGS   ANNUAL SAVINGS    ACTIONABLE        COVERAGE          RESOURCES
 $310.85           $3,730.23         13                24%               417

 ↓ DOWNSIZE 8  ·  ✕ TERMINATE 0  ·  ↑ UPSIZE 5
 = RIGHT-SIZED 71  ·  ○ NO SIGNAL 17  ·  ◌ PENDING 316

    NAME                                              CURRENT            RECOMMENDED   SAVINGS/MO
 ─────────────────────────────────────────────────────────────────────────────────────────────────
 ↓  botanix-fed-node-us-east1-mainnet                 e2-custom-4-22272  e2-highcpu-2      $79.50
 ↓  ip-10-1-5-50.us-east-2.compute.internal           t3a.xlarge         m5a.large         $47.01
 ↓  gke-botanix-main-clu-botanix-main-clu-2cc58415-…  e2-custom-4-20480  e2-highmem-2      $45.70
 ↓  gke-botanix-main-clu-botanix-main-clu-2cc58415-…  e2-custom-4-20480  e2-highmem-2      $45.70
Every command takes -o json for scripts and agents, and opens an interactive browser when you run it at a terminal with no flags.
Assign the spend
OpenCost splits cost by namespace. CostGraph assigns it to whoever should pay, from rules, and the rules can reach the bill the cluster's nodes appear on. This one tags every AWS charge carrying the cluster's eks:cluster-name tag as infra=demo, so the cost of running this demo shows up as one line:
costgraph tags create --key infra --value demo \
  --field 'tags.eks:cluster-name' --op equals --match cg-opencost-migration-demo \
  --description "EKS nodes of the demo cluster" --dry-run
costgraph   ·  new tag rule
# infra
  Key:                infra
  Scope:              billing
  Type:               literal
  Field:              tags.eks:cluster-name
  Operator:           equals
  Match:              cg-opencost-migration-demo
  Predicate:          tags.eks:cluster-name equals "cg-opencost-migration-demo"
  Value:              demo
  Description:        EKS nodes of the demo cluster

costgraph   ·  preview
# infra
  Matched rows:       0
this rule matches no cost rows
dry run: rule not created
Drop --dry-run to save it. From then on the infra key groups the cost overview and the recommendations, and, if you bill customers, the billing export. The rule matches once the day's rows reach the bill, and AWS includes that tag in the export only if it's activated as a cost allocation tag.
Replace OpenCost in the cluster
Clients that take a URL need only the two changes above. Clients that reach a
Kubernetes Service, kubectl cost among them, need a Service to reach. The
operator chart ships one: openCostApi runs a proxy Service named opencost
on port 9003 that injects the key and scopes requests to the cluster it runs
in, so it answers for that cluster alone rather than every cluster on the
account. Turn it on with an upgrade of the release you already installed:
helm upgrade costgraph-operator costgraph/costgraph-operator \
  --namespace costgraph \
  --reuse-values \
  --set openCostApi.enabled=true
kubectl cost --opencost looks for the Service in the opencost namespace, and
this release lives in costgraph, so name the Service and its namespace
yourself. Pass --historical to see what the window cost, rather than the
monthly rate the plugin projects by default:
kubectl cost namespace --kubecost-namespace costgraph \
  --service-name opencost --service-port 9003 \
  --allocation-path /allocation/compute \
  --window 1d --historical
+----------------------------+-------------------+------------------+-----------------+
| CLUSTER                    | NAMESPACE         | TOTAL COST (ALL) | COST EFFICIENCY |
+----------------------------+-------------------+------------------+-----------------+
| cg-opencost-migration-demo | shop              |         0.390820 |        0.000763 |
| __idle__                   | __idle__          |         0.263960 |        0.000000 |
| cg-opencost-migration-demo | costgraph         |         0.114470 |        0.140342 |
|                            | kube-system       |         0.105620 |        0.098248 |
|                            | prometheus-system |         0.008550 |        1.000000 |
|                            | opencost          |         0.006760 |        0.227293 |
+----------------------------+-------------------+------------------+-----------------+
| SUMMED                     |                   |         0.890180 |                 |
+----------------------------+-------------------+------------------+-----------------+
The Service names the cluster, so the plugin sees this cluster's namespaces and this cluster's idle, not every cluster on the account.
Remove OpenCost
After your clients read from CostGraph and the reporting window you care about is covered, remove OpenCost and the Prometheus you ran for it:
helm uninstall opencost --namespace opencost
helm uninstall prometheus --namespace prometheus-system
If other tools read that Prometheus, keep it and remove only OpenCost.
Clean up
If you created the EKS cluster for this walkthrough, delete it with the same config file:
eksctl delete cluster -f cg-opencost.yaml
Summary
The cluster reports to CostGraph, the clients that read OpenCost read CostGraph, and the questions you used to ask OpenCost have answers in the CLI next to the bills the cluster never saw. The OpenCost API page has every route and parameter, and what carries over.
If this sounds useful, get started for free or book a demo today.
Frequently Asked Questions
Do my OpenCost clients need code changes?
Two settings: the base URL and an X-API-Key header. The routes, query parameters, and response fields are the ones OpenCost defines. A client that hardcodes http://opencost:9003 needs that value replaced.
Do OpenCost's Grafana dashboards work?
No. They read OpenCost's Prometheus metrics, and the CostGraph operator doesn't emit that metric family. Read the allocation API or use the CostGraph dashboard.
Does kubectl cost work?
Yes, once a Service named opencost answers in the cluster. The plugin reaches a
Service rather than a URL, so Replace OpenCost in the cluster
turns on the chart's openCostApi proxy and kubectl cost keeps reading it.
Which parts of the API aren't served?
idleByNode is accepted and ignored; idle is reported for the cluster. The
/customCost routes aren't served, because /cloudCost reports software service
spend next to cloud spend. Everything else carries over, including filter and
the storage, network, and load balancer costs on each allocation.
Do I have to run Prometheus?
No. The operator ships its own scrapers and remote-writes to CostGraph. If you ran Prometheus only for OpenCost, remove it with OpenCost.