Latest from the blog
Deep dives, release notes, and ideas from the CostGraph team on cloud cost optimization and infrastructure efficiency.
CostGraph becomes a Google Cloud partner
We can help you negotiate Google Cloud pricing alongside our cost visibility and rightsizing recommendations.
Announcing CostGraph AutoPilot for CI
Automatically route GitHub Actions jobs to a provider and runner size that fit your cost and performance policy, using job history and measured resource usage.
CostGraph launches support for Cencori
Bring Cencori model usage into CostGraph to understand AI spend alongside the compute, databases, and other services behind your applications.
How to meter and price every token type per customer from your AI gateway
Attribute AI gateway usage to your customers, split it into input, output and cache tokens, and send each to its own priced meter in Stripe, Metronome, Orb and more.
CostGraph is now SOC 2 Type II compliant
CostGraph has successfully completed its SOC 2 Type II examination, giving customers independent evidence to support their security reviews.
Preventing cost abuse with CostGraph and Slack
Use cost attribution and alert routing to get unexpected infrastructure spend to the team that can act on it.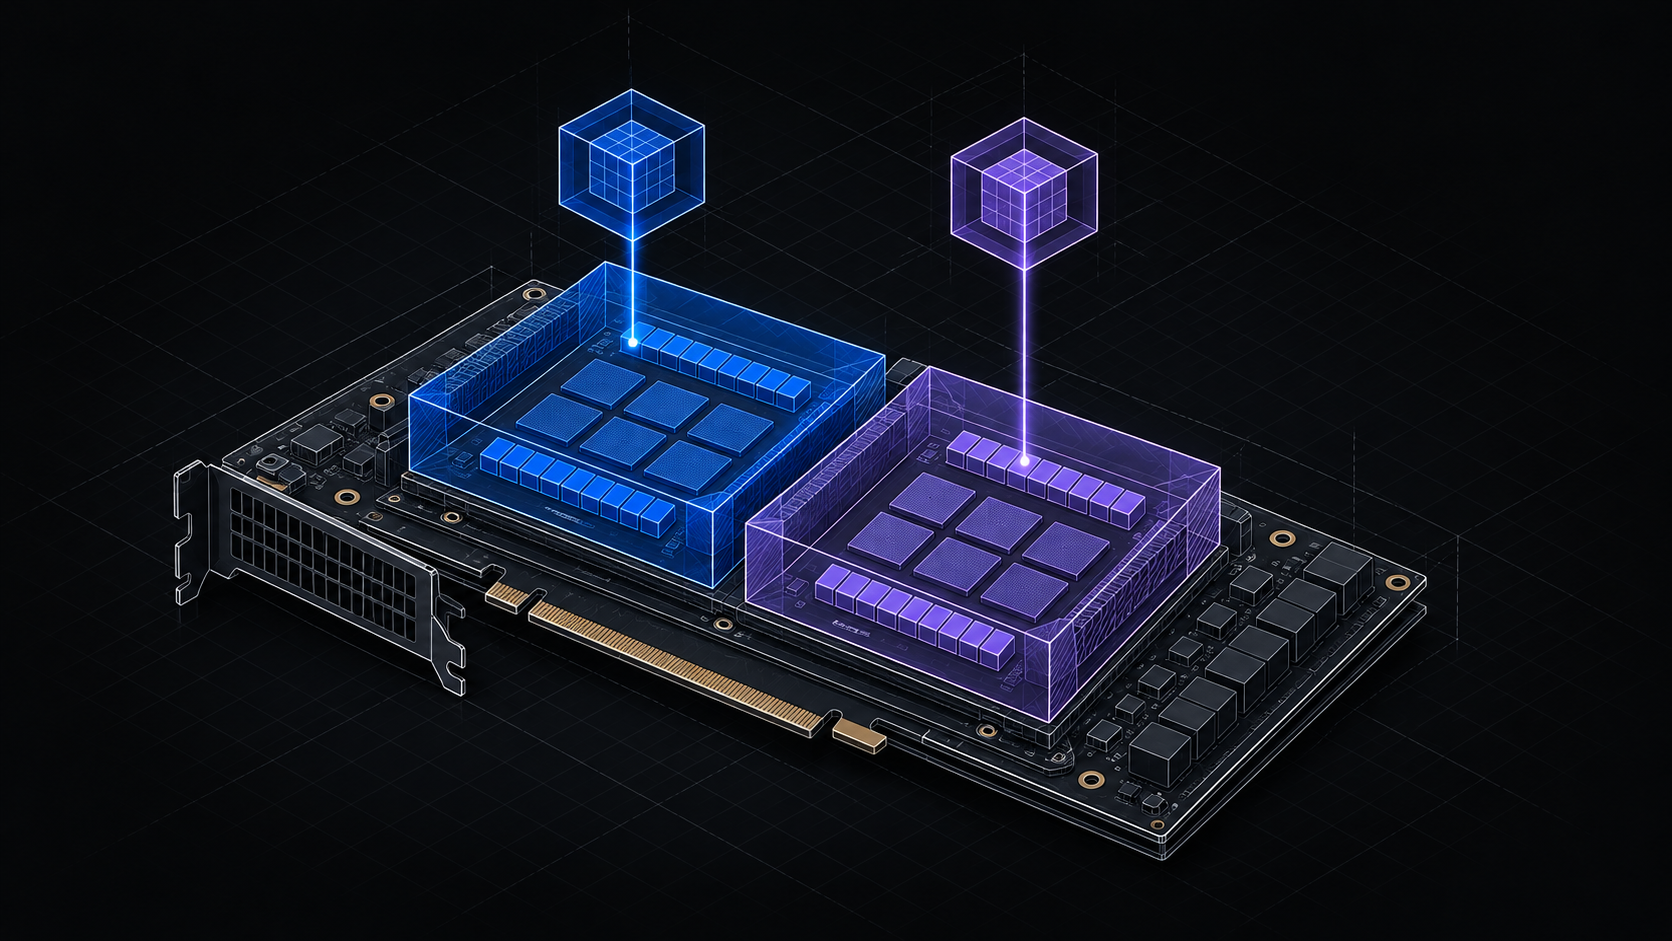
how do MIGs on Kubernetes work?
How MIG partitions a GPU, how Kubernetes allocates it, and how isolation differs from time-slicing.
CostGraph becomes a DigitalOcean partner
We can help you obtain and negotiate better rates for your DigitalOcean bill, alongside our cost visibility and rightsizing recommendations.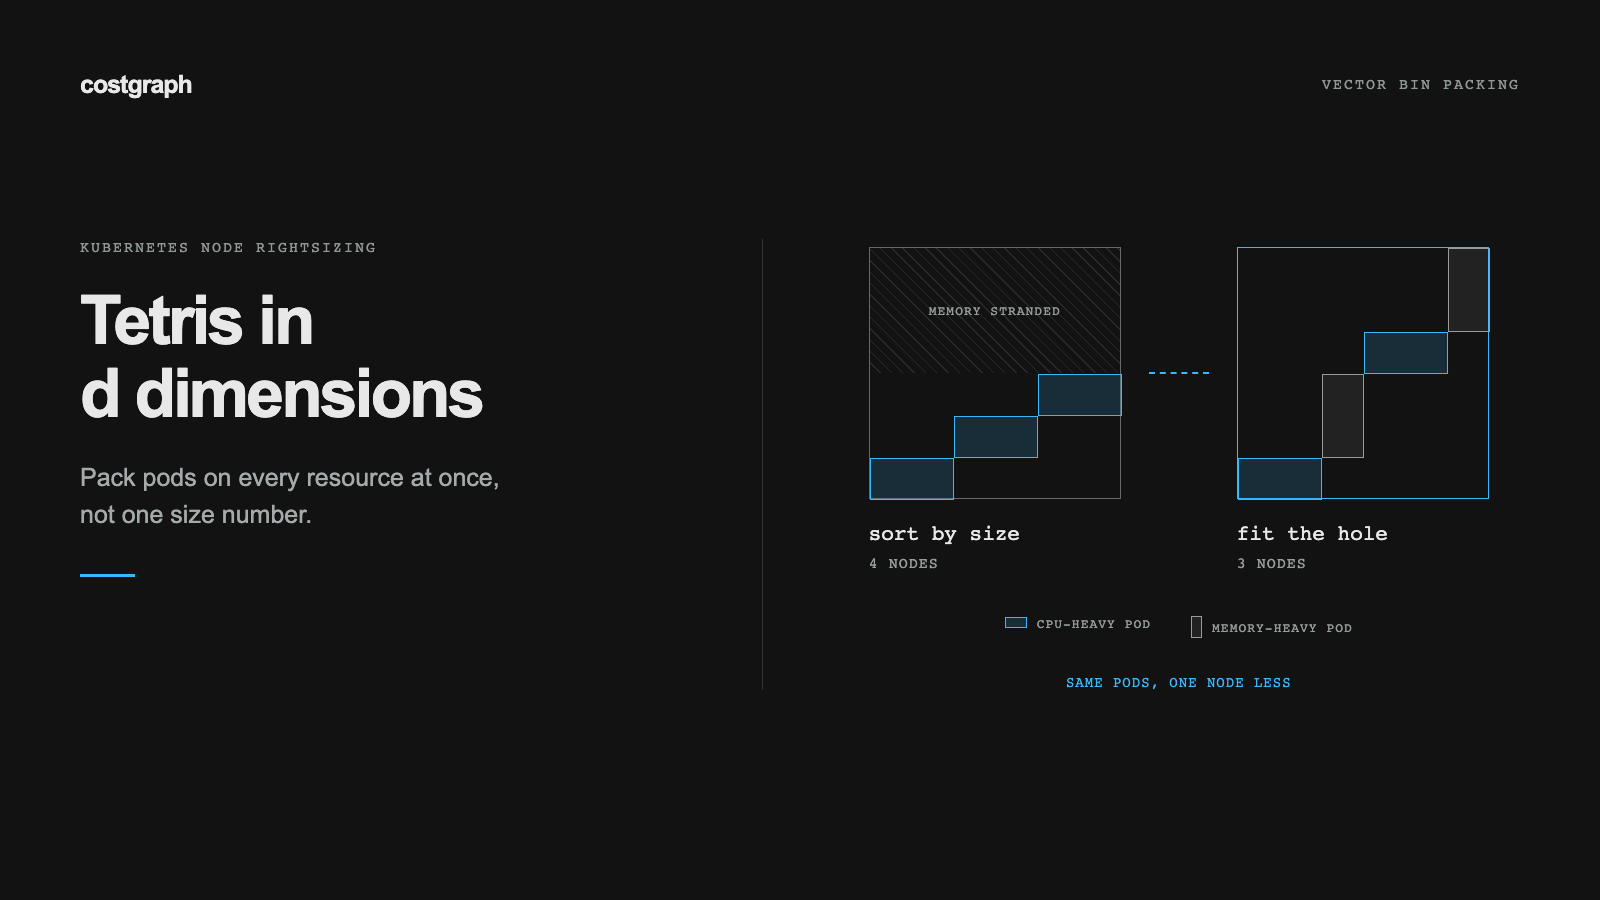
Tetris in d dimensions: how we rightsize Kubernetes nodes
Node rightsizing is vector bin packing. How CostGraph sizes pods from real usage, checks every placement against the scheduler, and packs with geometric heuristics instead of first fit decreasing.
Building invisible pipelines with GitOps
How we use GitOps and Argo CD to make our deployment pipelines invisible and help us ship faster.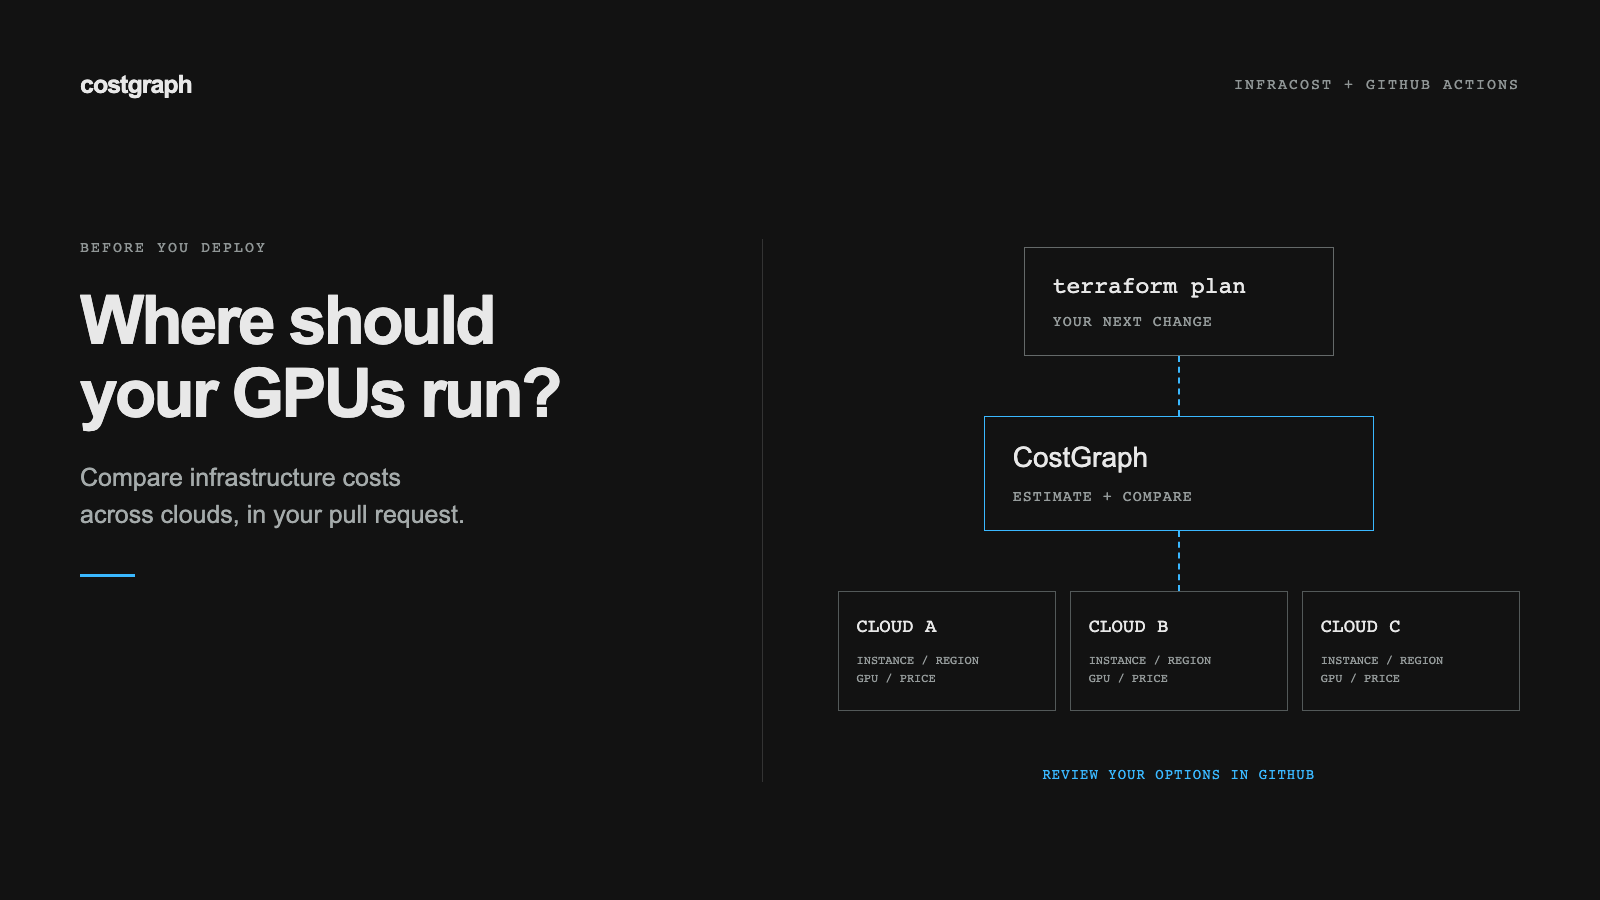
Compare GPU infrastructure costs before you deploy
Track the cost impact of your Terraform with the CostGraph GitHub Action.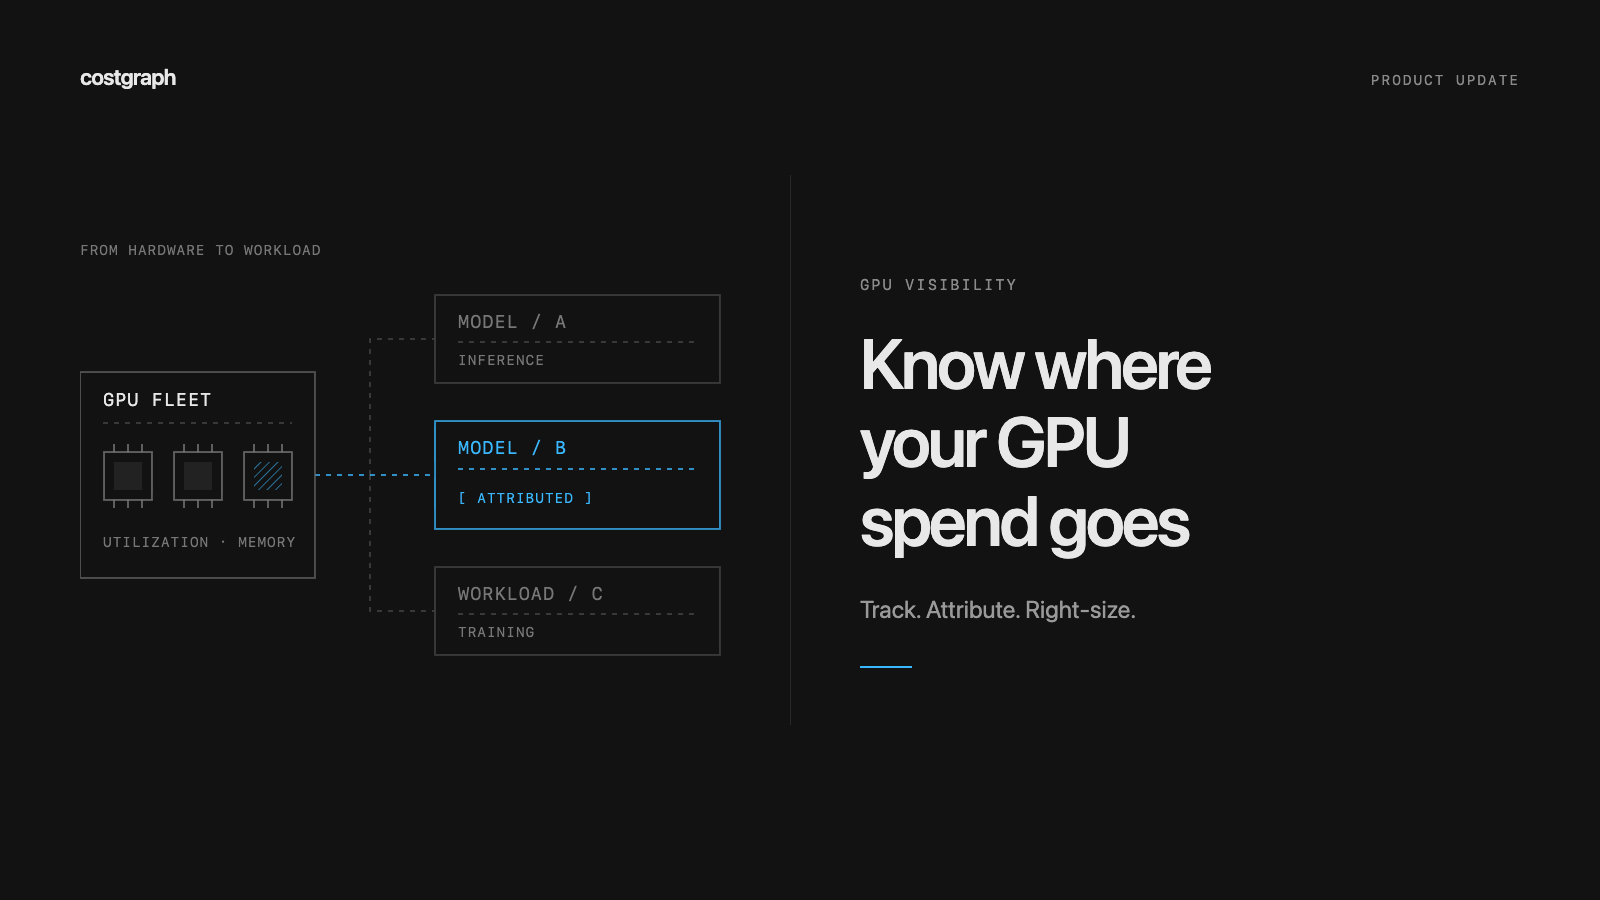
Know where your GPU spend goes
Track your GPU fleet, connect accelerators to workloads and model serving, and find capacity worth reclaiming with CostGraph.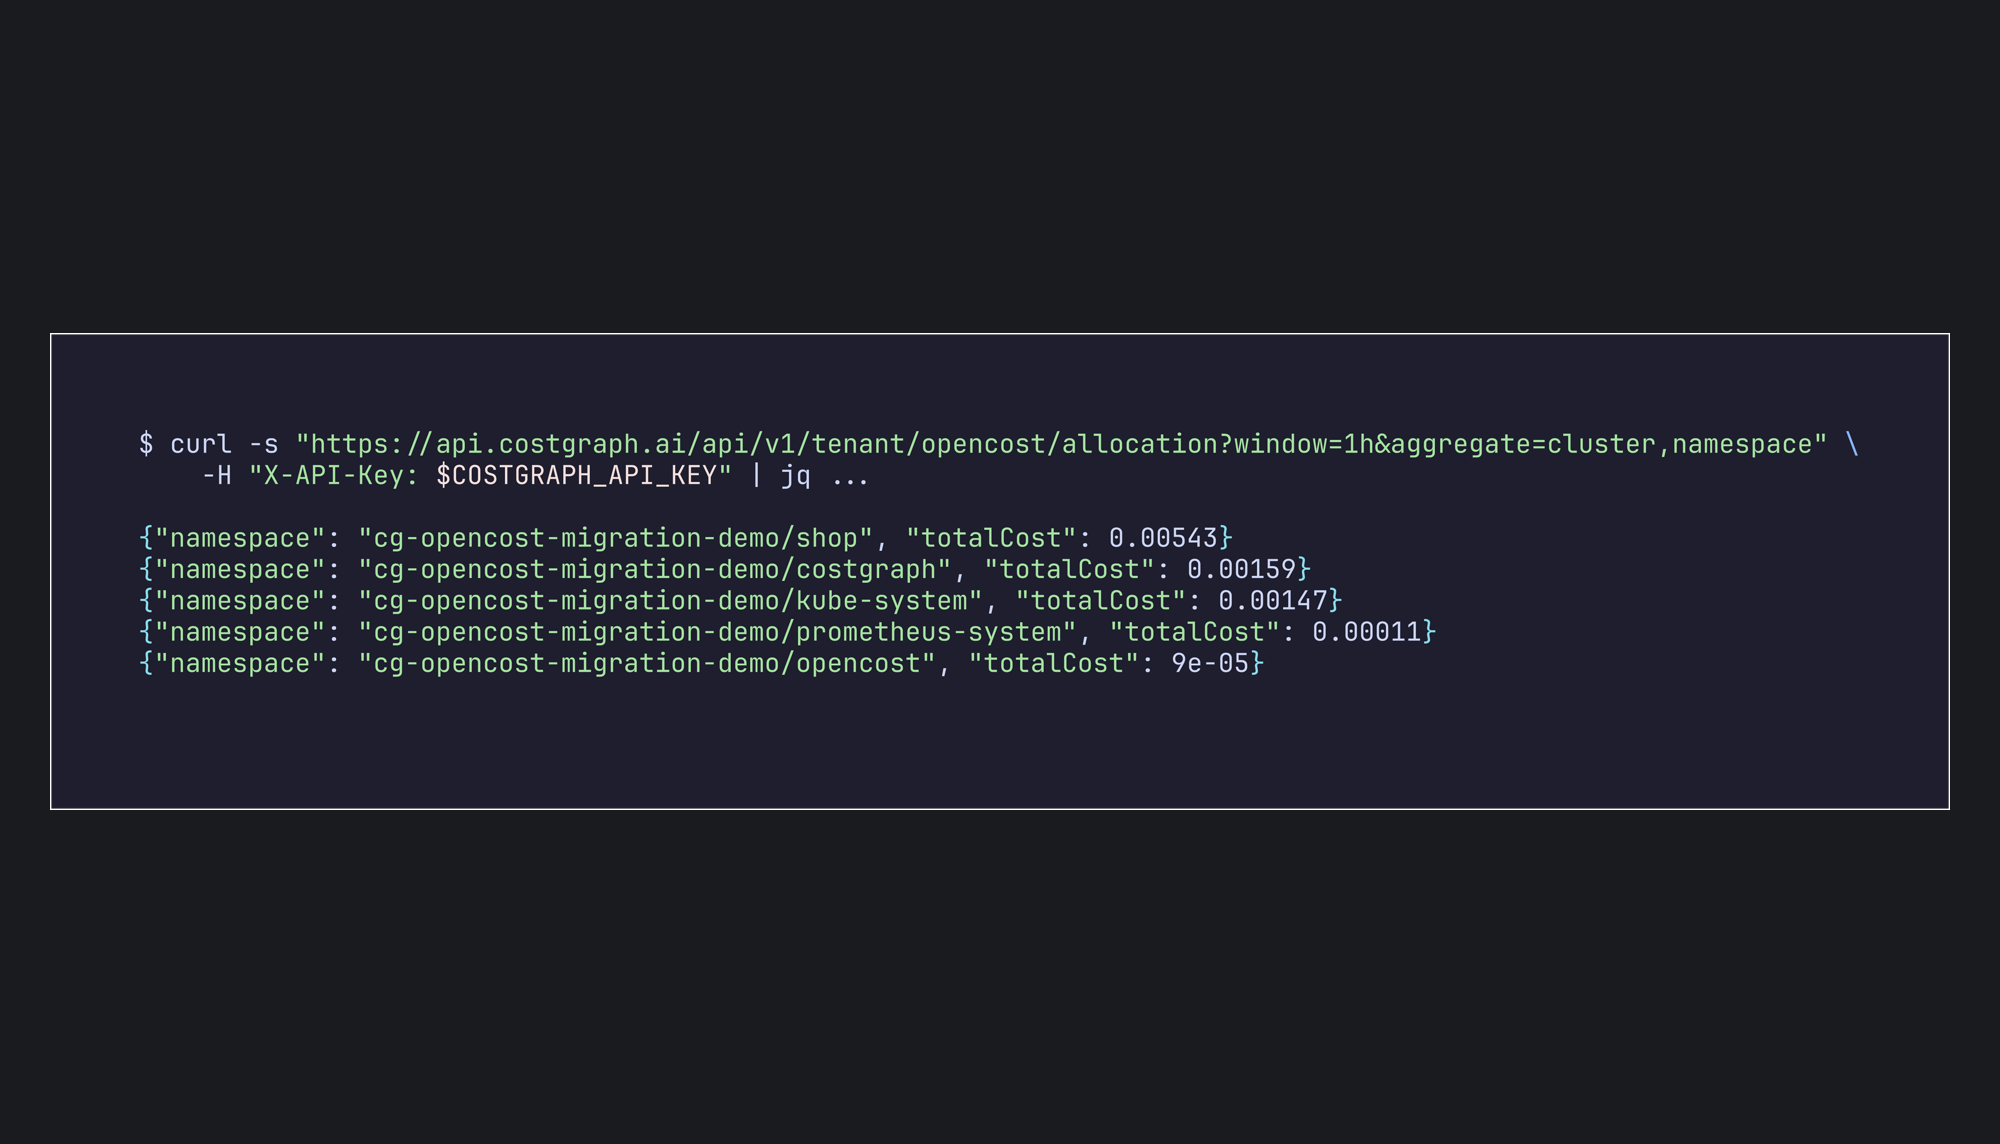
Migrating from OpenCost to CostGraph
CostGraph is now a drop-in replacement for OpenCost: keep the clients you built on the OpenCost API, cover the bills outside the cluster, and answer the same questions with the CostGraph CLI.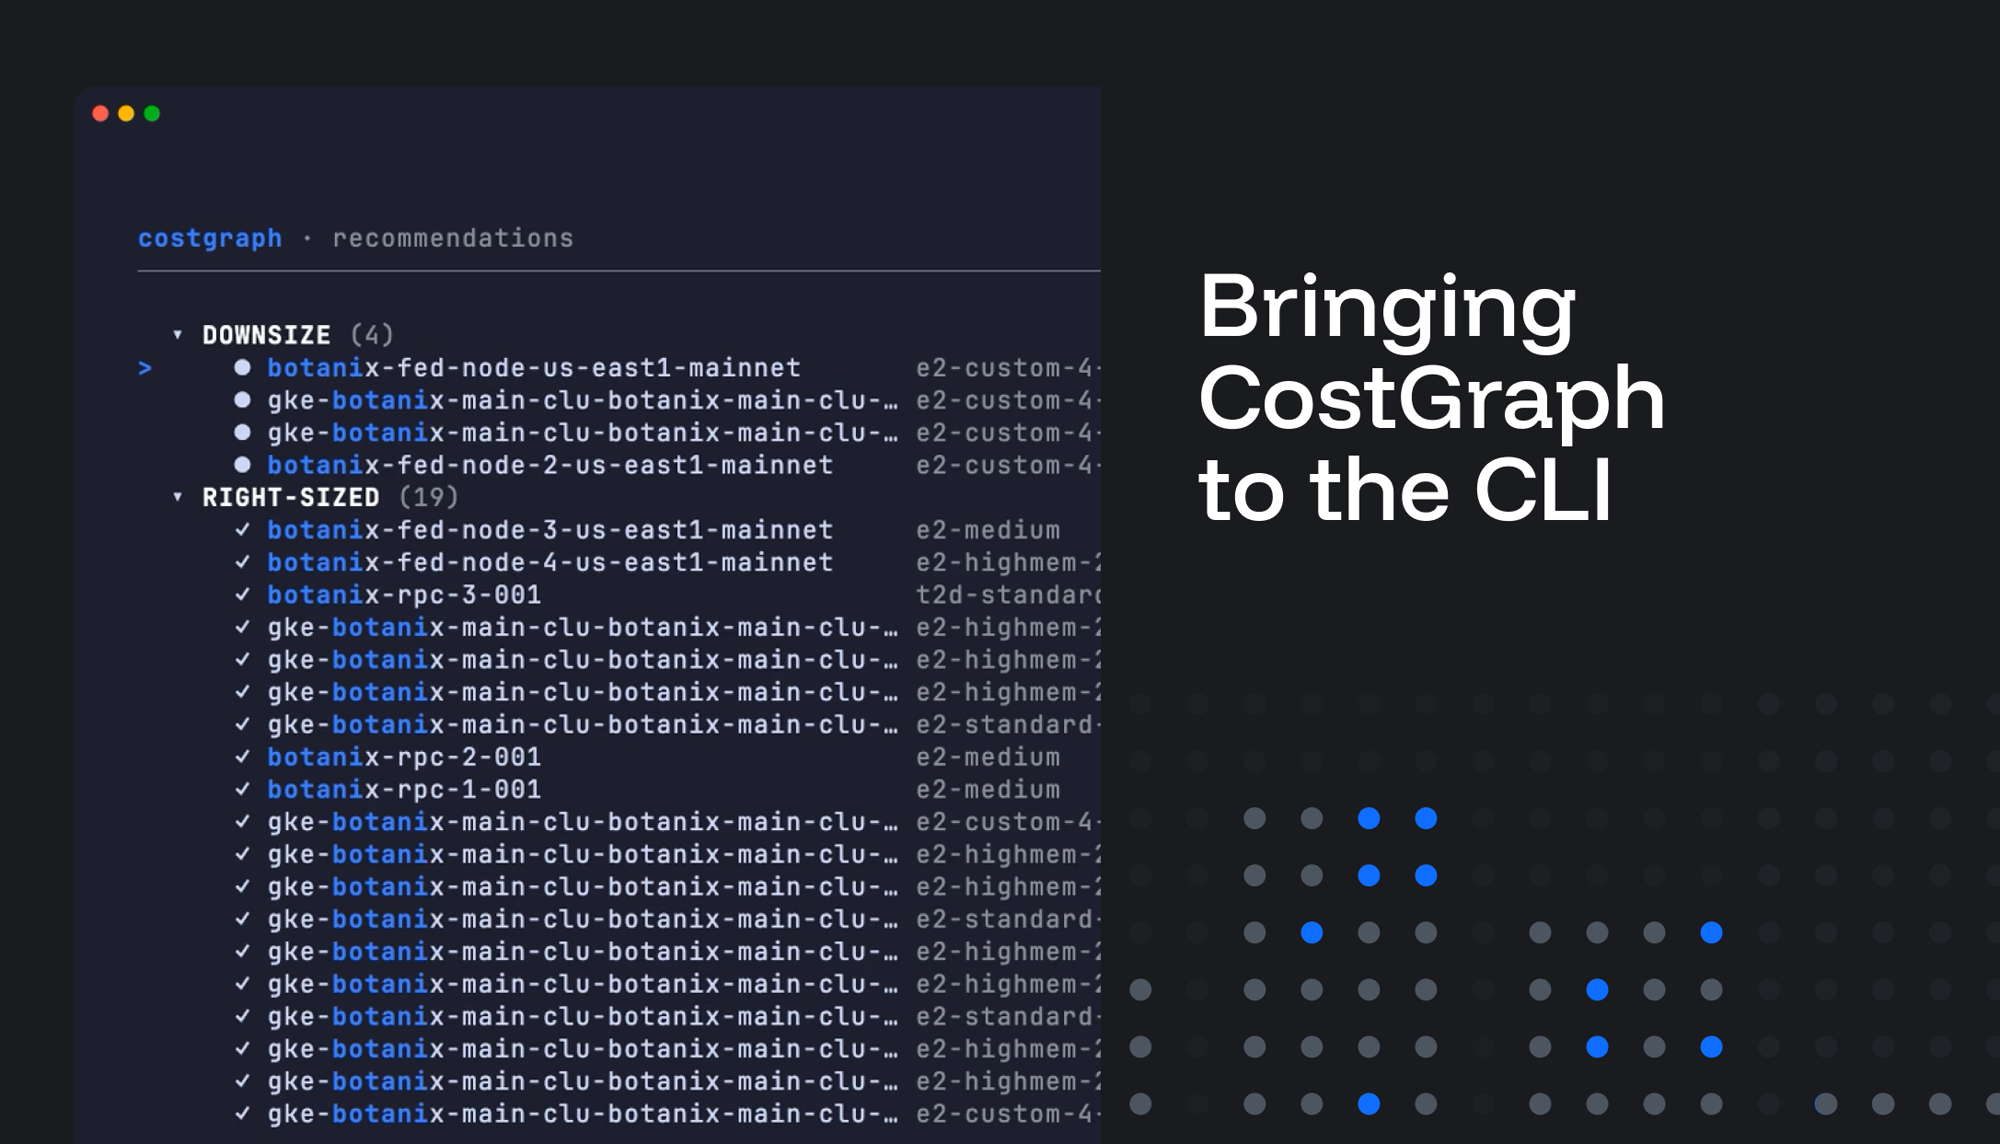
Bringing CostGraph to the CLI
CostGraph announces early access to the CostGraph CLI.
CostGraph launches support for Stripe
Our first export integrations send data out instead of in. CostGraph now reports each customer's attributed cloud spend to a Stripe billing meter every night, so infrastructure costs land on the invoice as line items.
CostGraph launches support for Autumn
CostGraph now exports tenant compute usage as billable meters to Autumn, so usage-based SaaS can bill on the same container, runtime, CPU, and memory data they use to monitor costs.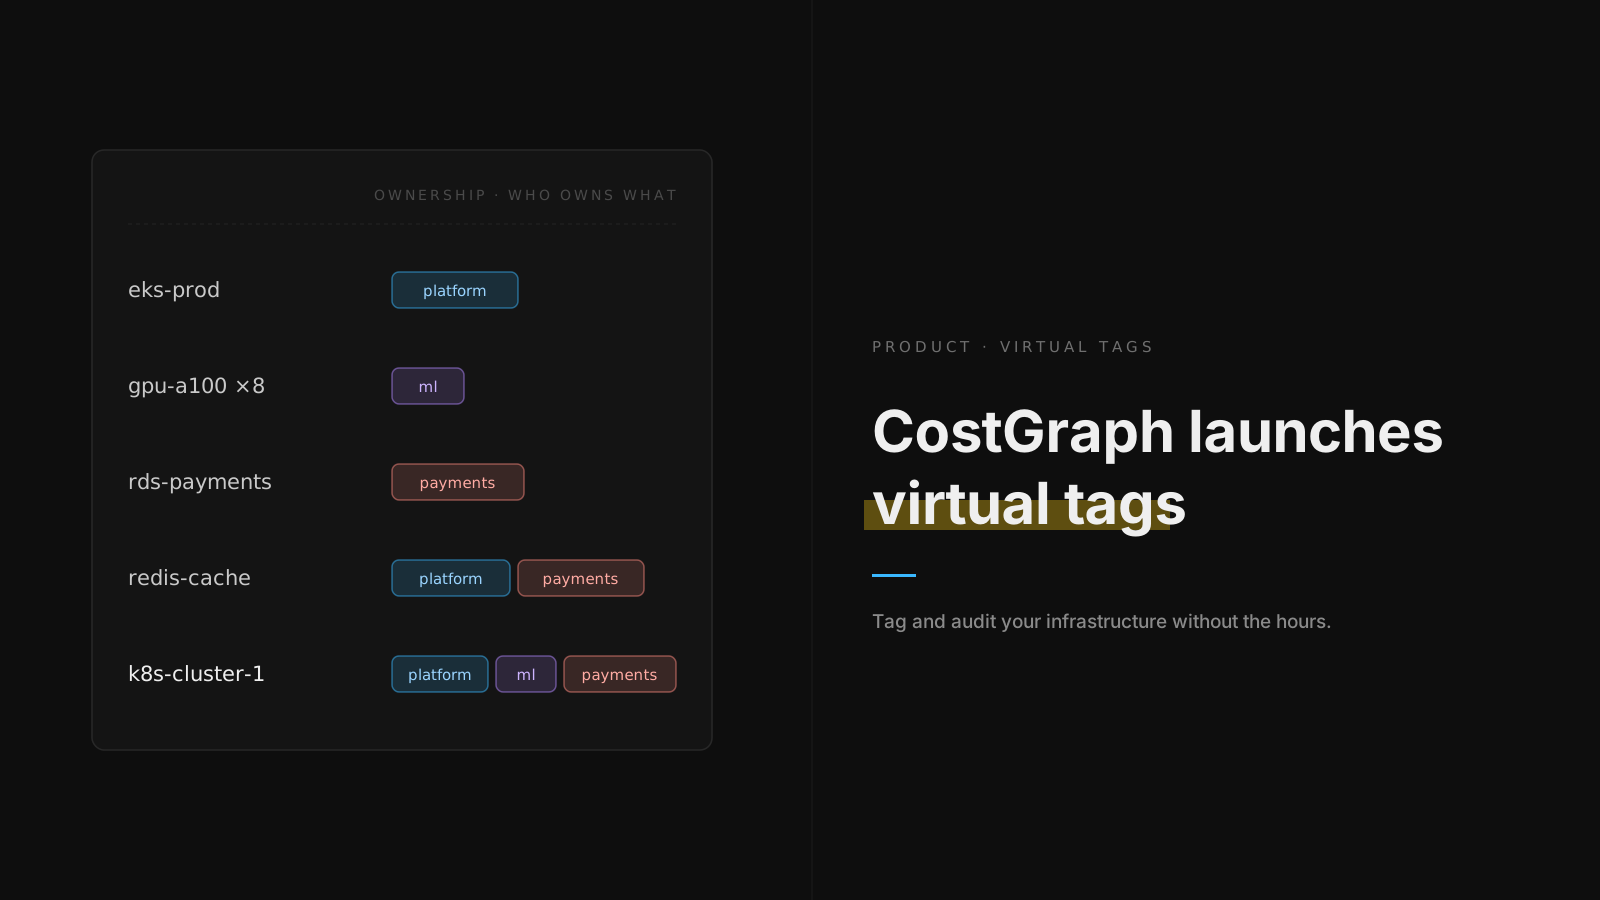
CostGraph launches virtual tags
Tag any resource CostGraph has indexed without touching your infrastructure. Write rules once, describe them in plain English with Graph AI, and see who tagged what.
CostGraph launches support for Depot
CostGraph now imports Depot container-build, GitHub Actions runner, storage, and sandbox usage, so CI spend sits next to cloud and infrastructure costs, with cache minutes saved visible alongside minutes billed.
CostGraph launches support for OpenRouter
CostGraph now imports OpenRouter activity data, so teams can analyze model spend by model, upstream provider, and endpoint alongside their cloud and infrastructure costs.
CostGraph launches support for Google Cloud costs
CostGraph now ingests Google Cloud billing data from the FOCUS and Detailed usage cost exports in BigQuery, reconciling allocated and unallocated costs against your invoice with keyless access via Workload Identity Federation.
CostGraph launches first-class support for AWS
CostGraph now ingests AWS cost and usage data from a FOCUS 1.2 Data Export, preserving Savings Plans and Reserved Instance attribution, and reconciling allocated and unallocated costs against your invoice.
CostGraph launches support for PlanetScale costs
CostGraph now imports PlanetScale invoice line items and database metadata, normalizing PlanetScale spend into the same cost model as your cloud and Kubernetes costs.
If no one is looking at dashboards, what's next for the future of interfaces?
If no one is looking at dashboards, what replaces them? Notes on on-demand interfaces, MCP, and where we are taking CostGraph next.
10 Best Kubernetes Cost Optimization Tools for 2027
Compare 10 Kubernetes cost optimization tools for 2027 by cost allocation, rightsizing, automation, and operational fit. Build your shortlist.
Prometheus Rules
Prometheus rules. What they are, why they exist and how we use them.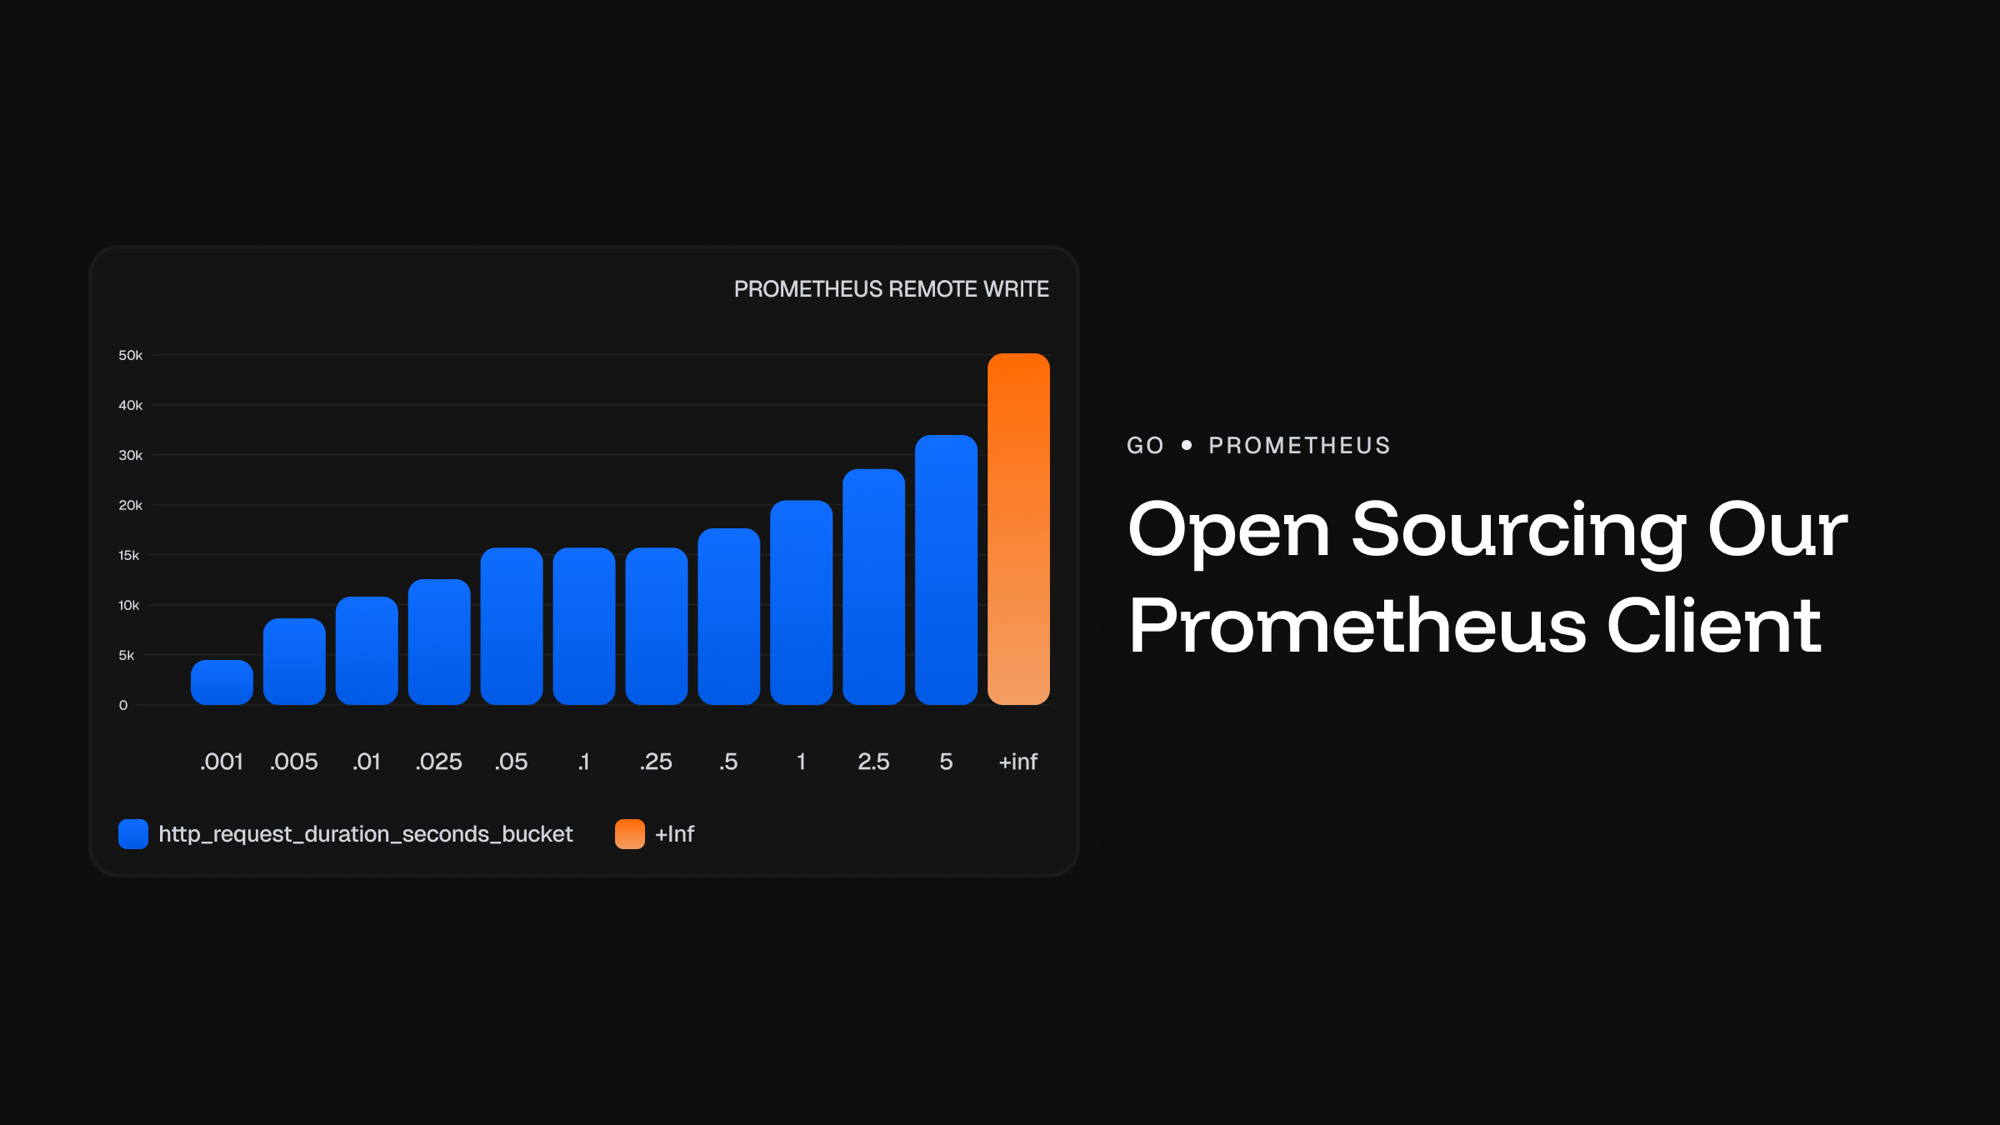
Open Sourcing Our Prometheus Client
Why we built our own Prometheus remote-write client for the CostGraph agent — and why you might want to use it too.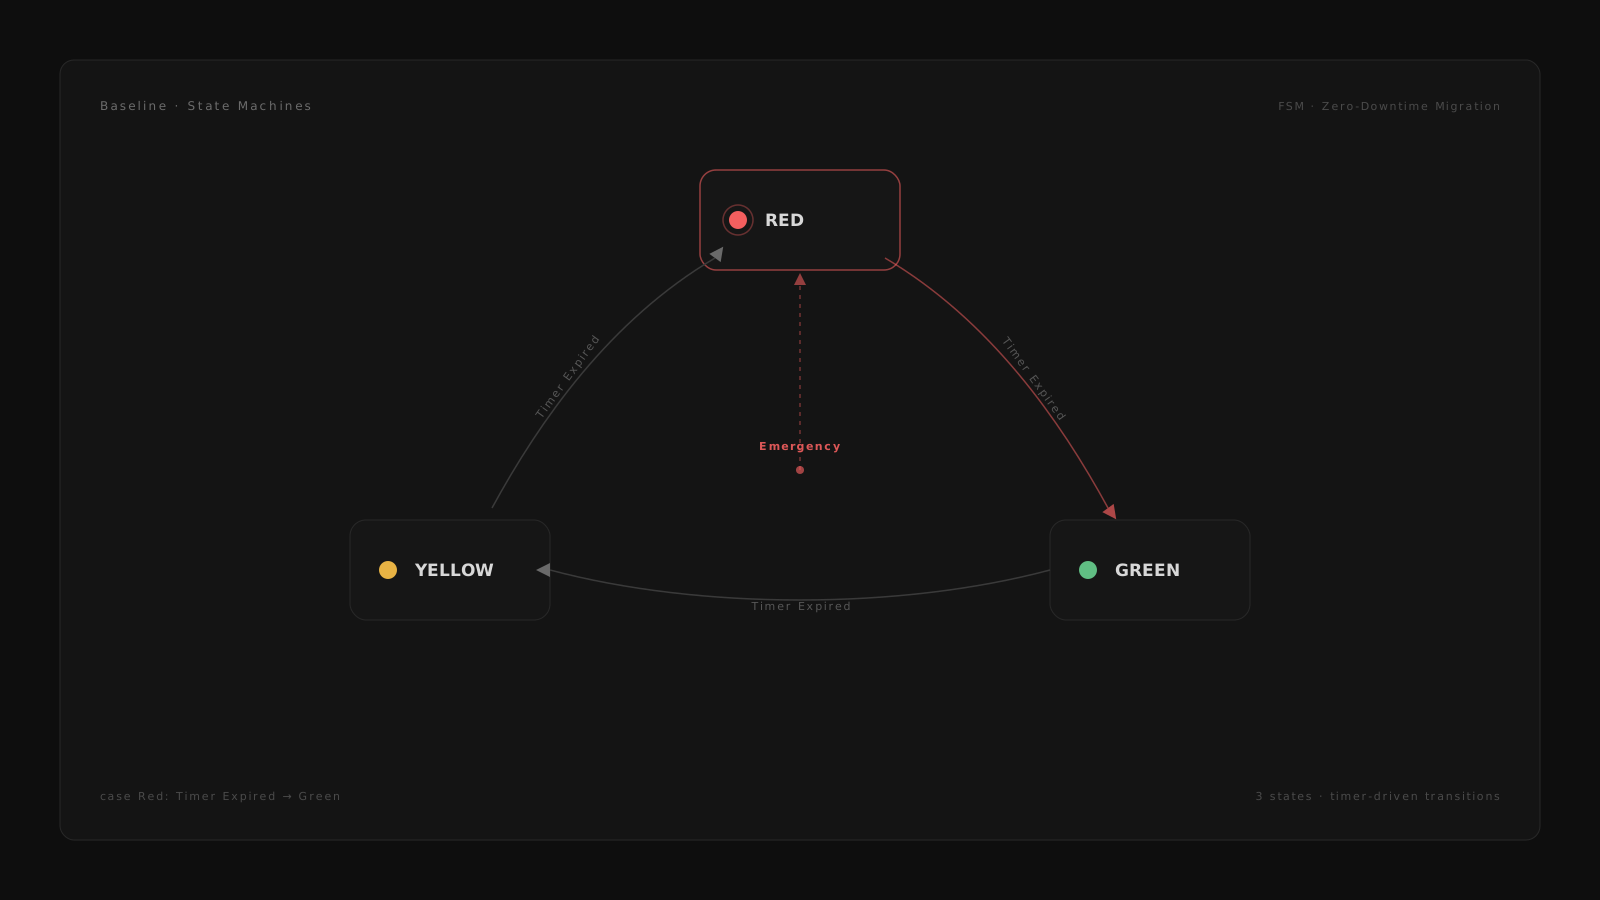
Distributed systems at Baseline: State Machines
How we applied state machines to solve complex live migration challenges at Baseline.Questions, answered
The things people ask before connecting a provider.
A cloud cost platform that works from your actual bill. It ingests FOCUS billing data, reconciles it to your invoice, attributes every dollar to teams and workloads through virtual tagging, and puts GraphAI on top to find, explain, and fix waste.
Connect a provider’s billing export and CostGraph reads it in place, no agents on your machines. The operator adds Kubernetes detail, and the MCP server brings your cost data into Claude, Cursor, Codex and the other coding agents your team already uses.
Every team sees its own spend, on the same numbers finance sees. Rules tag resources once, past and future, so attribution stays right as things change, and rightsizing arrives with the savings attached for the owning team to approve.
Ask it a question in plain language and it answers from your bill, with the query behind every number. It spots what changed, explains why, and turns findings into reports and dashboards you can share.
Yes. AWS, Azure and Google Cloud land in the same FOCUS shape, alongside Kubernetes and AI provider spend, so you compare and attribute across all of them in one place.
Got any more questions? Contact us.

