 ChatGPT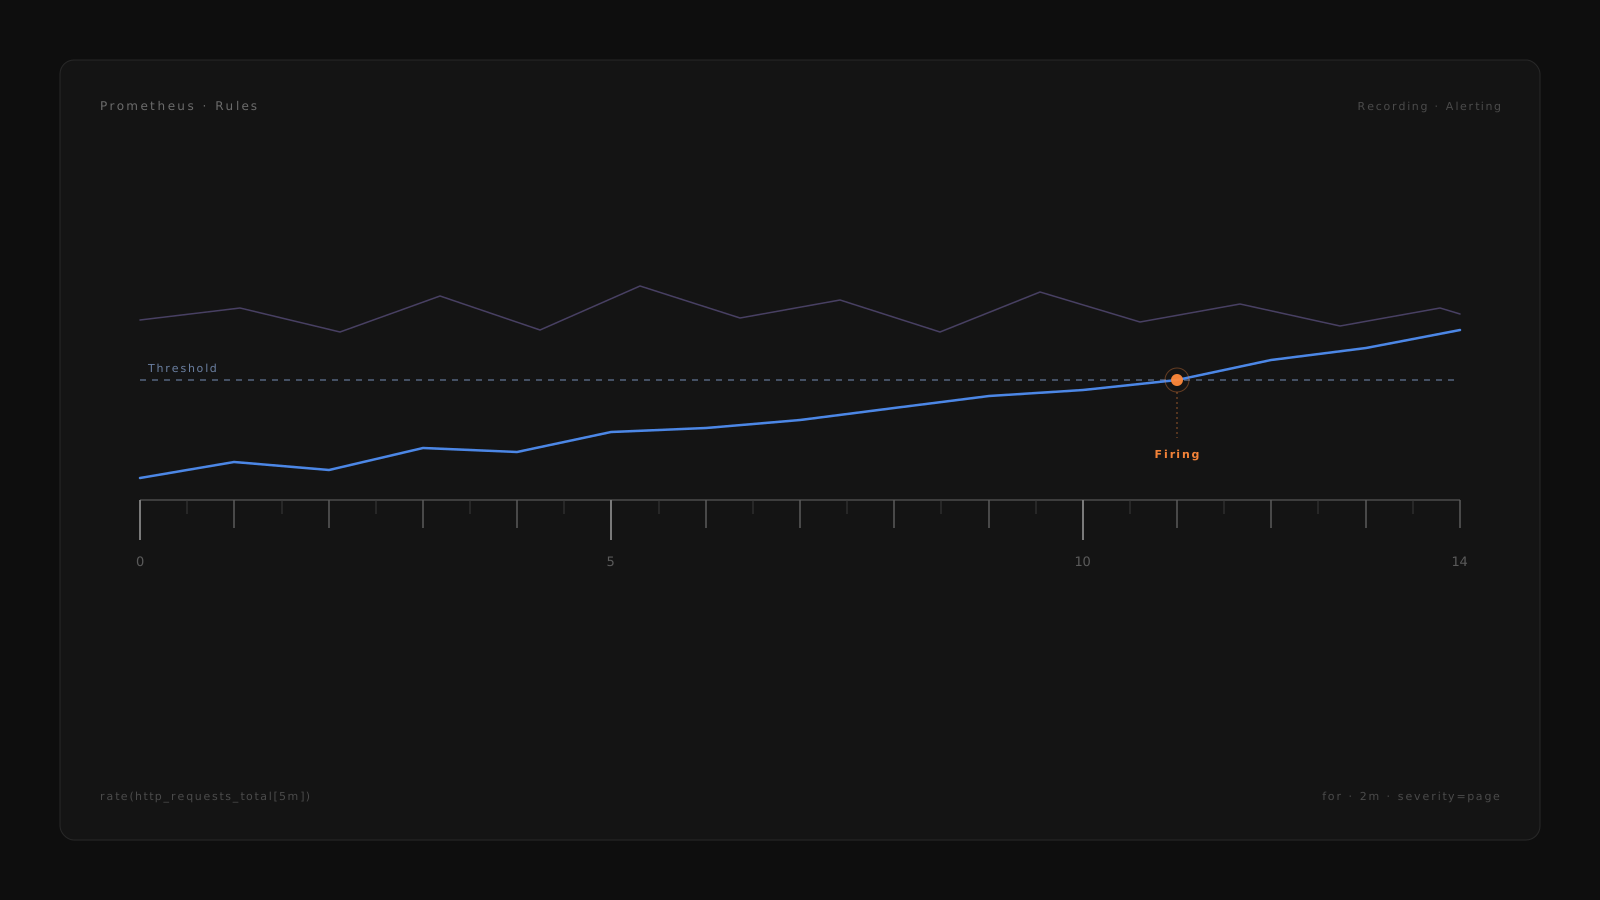
In a previous blog I went over some of the ways Prometheus powers our infrastructure. Continuing on the Prometheus theme, I wanted to talk about a neat feature you might already be using but haven't given much thought to.
Prometheus rules.
What is a Prometheus rule?
Before jumping into a formal definition it is important to establish some context around why this feature exists. Consider the query:
sum by (cluster, namespace, pod, container) (
  rate(container_cpu_usage_seconds_total{image!="", container!=""}[5m])
)
/ on (cluster, node) group_left
sum by (cluster, node) (
  kube_node_status_allocatable{resource="cpu"}
)
* on (cluster, node) group_left (instance_type, region)
kube_node_labels
The query above is fine as a one-off. It pulls data from a few sources (cadvisor for container CPU, kube-state-metrics for node capacity, and node labels for instance metadata) and returns a per-container share of CPU annotated with the underlying instance type and region. That is acceptable for a quick check, but if you need to run it every few seconds across thousands of series you do not want to wait minutes for each evaluation.
A much faster approach is to run the query in the background and store the output as a metric of its own.
Prometheus rules are exactly that. They let you compute complex queries ahead of time and define alert conditions on top of them.
Prometheus rules are of two types:
- Recording rules
- Alerting rules
Recording rules
Recording rules let you precompute a large or expensive query and store the output as a regular Prometheus time series. Subsequent queries hit the stored series instead of re-evaluating the original expression, which keeps dashboards snappy and reduces load on the TSDB.
Alerting rules
Alerting rules let you define conditions on metrics and fire when a threshold is crossed. For example, if request_latency_seconds exceeds 1 for 5 minutes, fire an alert.
At Baseline we use recording rules to power dynamic cost attribution. Container counts, node capacity, and instance lifetimes all shift constantly in our customers' clusters, so we precompute per-container shares of node CPU and memory, along with node uptime, on a fixed cadence.
Understanding recording rule syntax
Recording rules generally follow this format:
groups:
  - name: <group_name>
    interval: <evaluation_interval>
    rules:
      - record: <new_metric_name>
        expr: <promql_expression>
        labels:
          <label_name>: <label_value>
Where:
nameis the rule group. Rules within a group evaluate sequentially, so later rules can reference series produced by earlier ones.intervalsets how often the group evaluates. Defaults to Prometheus's globalevaluation_intervalif omitted.recordis the name of the new time series the rule produces. By convention this islevel:metric:operations(e.g.node:cpu:rate5m).expris the PromQL expression to evaluate.labelsare optional labels merged into every output sample.
A concrete example, taken from the cost-share group we run in production:
groups:
  - name: costgraph_cost_share
    interval: 5m
    rules:
      - record: container:cpu_share:ratio
        expr: |
          sum by (container, namespace, node) (
            rate(container_cpu_usage_seconds_total{image!=""}[5m])
          )
          /
          on (node) group_left
          sum by (node) (
            kube_node_status_allocatable{resource="cpu"}
          )
Alerting rules follow a similar shape:
groups:
  - name: <group_name>
    rules:
      - alert: <alert_name>
        expr: <promql_expression>
        for: <duration>
        labels:
          severity: <severity>
        annotations:
          summary: <short_description>
The differences from a recording rule: alert replaces record, and for sets how long the expression must be true before the alert actually fires (suppressing flaps).
Configuring recording rules
Getting up and running with rules is fairly straightforward. You create a file (e.g. rules.yml), define your rules, and reference the file from your global Prometheus config:
rule_files:
  - "rules.yml"
Then validate the file with promtool:
promtool check rules rules.yml
After which you can reload or restart the server.
The problem is that if you prefer one file per rule and you have a few dozen of them, this process quickly becomes error-prone. And the bigger issue for us: it is not programmatic. Every rule change is a config edit, a promtool invocation, and a reload. That is fine for a handful of static alerts but painful when rules are derived from inventory or tenant state.
Introducing Ruler
Our solution to this was yet another library: Ruler, a small Go package for managing Prometheus rules programmatically.
Ruler is scoped to recording rules specifically. Alerting rules go through Alertmanager and a separate evaluation path, so they are out of scope here. Since our use case is dynamic cost attribution, which is entirely precomputed series, recording rules are all we need.
Ruler treats rule groups as first-class Go values. You construct them, validate them in-process (the same checks promtool runs), write them out to disk in the layout your Prometheus expects, and trigger a reload, all from one binary. No shell, no templating, no orchestration glue.
For us that unlocks a few things:
- Rules derived from state. Our cost-attribution rules depend on which clusters, tenants, and node groups are active. Ruler lets us regenerate the rule set whenever inventory changes instead of hand-editing YAML.
- Safe rollouts. Validation runs before anything touches disk.
With Ruler, instead of the workflow described above, we can now define rules like so:
package main

import (
    "context"
    "log"
    "time"

    "github.com/baselinehq/ruler"
)

func main() {
    cfg, err := ruler.ParseConfigFile("rules.yaml")
    if err != nil {
        log.Fatal(err)
    }

    mgr, err := ruler.NewManager(ruler.ManagerConfig{
        Writer:             &logWriter{},
        Context:            context.Background(),
        EvaluationInterval: time.Minute,
    })
    if err != nil {
        log.Fatal(err)
    }
    defer mgr.Stop()

    if err := mgr.Apply(*cfg); err != nil {
        log.Fatal(err)
    }

    select {} // block until shutdown
}
In the example above we use Ruler to parse a regular rule definition and pass it to a Manager. This can then be applied to a Prometheus instance, and the subsequent result is handed to a Writer type.
Closing thoughts
Prometheus rules are a great feature that allows you to not only save time by simplifying queries but also run expensive queries at predetermined times without much overhead during normal operations.
Ruler enabled us to much more freely manipulate and interact with rules through a language we use on a daily basis. If this sounds like it could be useful to you, give it a shot, let us know what you think and leave a star!